Create a Custom Obsidian Mood Tracker Template

A mood tracker template is more than just a place to jot down how you're feeling; it's a structured way to start spotting emotional patterns day-to-day. When you bring this practice into a tool like Obsidian, you're building a highly personalized and completely private log that weaves your feelings directly into your notes, projects, and daily life. It’s a huge step up from the isolated experience of generic apps.
Why Track Your Mood in Obsidian
Let's be honest, most standalone mood tracking apps feel disconnected. The data sits in its own little silo, totally separate from the projects stressing you out, the meetings that drain your energy, or the journal entries where you're trying to make sense of it all. Obsidian completely flips that script by pulling your mood tracking right into your central knowledge base.
This simple shift turns mood logging from a chore into a powerful tool for self-discovery. Instead of just noting you felt "stressed," you can literally link that feeling to the project note that triggered it or the daily journal entry where you unpacked why. This is where a custom mood tracker template really shines.
The Power of an Integrated System
An integrated system gives you something standalone apps never can: context.
Tracking your mood inside Obsidian fits perfectly with concepts like the Second Brain method, which is all about creating a digital extension of your mind. Your emotional state is a massive piece of that puzzle. Once you start capturing it alongside everything else, you can ask much deeper questions:
Does my mood consistently dip on days packed with back-to-back meetings?
Is there a link between my energy levels and the progress I'm making on that big project?
Which activities actually, reliably, make me feel good?
Privacy and Personalization First
The mental health app market is exploding—it's projected to top $6 billion globally in 2025. Clearly, people want these tools. At the same time, with studies showing that 76% of employees feel stress hurts their productivity, the need for private, effective solutions has never been greater. You can read more about current mood tracking trends on vantagefit.io.
This is where Obsidian's local-first philosophy is a game-changer. Your most personal data—your moods, your thoughts, your fears—stays on your device. You own it. It's not sitting on a corporate server, ripe for data mining.
When you add a tool like Obsibrain to the mix, this data becomes even more potent. As a use case, imagine you tag a daily note with mood: low and also link to a [[Project Alpha]] note. Obsibrain can visually map this connection, helping you see over time that [[Project Alpha]] is a consistent source of stress. This isn't just tracking anymore; it's building genuine self-awareness.
Setting Up Your Mood Tracking Toolkit
Before we can build your custom mood tracker, we need to gather the right tools inside Obsidian. Think of this as laying the foundation for your new system. We're going to lean on a few fantastic community plugins to automate the heavy lifting and bring your data to life. Getting these installed is the first real step toward a more insightful tracking habit.

These plugins are designed to work together, creating a seamless experience. Without them, you'd be stuck manually creating daily notes and trying to connect the dots yourself—which pretty much defeats the purpose of building an efficient system in the first place.
Essential Community Plugins
First, head over to Settings > Community Plugins in Obsidian. You'll need to turn off "Safe Mode" if you haven't already, then you can browse for and install the following plugins:
Templater: This is the automation engine of our whole setup. It lets you create dynamic templates that can automatically pop in dates, prompts, and other structured data whenever you create a new daily note.
Dataview: Think of this plugin as your personal data analyst. It scans your notes, pulls out the data you log (like your mood rating), and neatly organizes it into tables and lists on a central dashboard.
Calendar: A simple but vital addition. This plugin gives you a visual calendar right in the sidebar, making it super easy to jump between your daily notes or see at a glance which days you've missed.
Once these three are installed and enabled, you have the basic framework. Templater creates the daily entry, you fill it out, and Dataview organizes the results. This trio is the core of our data collection and organization machine.
But what about making sense of it all? Raw data in a table is useful, but real insight comes from seeing the connections. This is where Obsibrain steps in, acting as a powerful visualization layer on top of your data.
For instance, you could use Obsibrain's knowledge mapping feature to create a visual hub for "Anxiety." This hub would automatically pull in and display links to every daily note, meeting summary, or project update where you mentioned feeling anxious. It transforms scattered data points into a clear, explorable map of your emotional landscape. To see how it all comes together, you can learn more about how to get started with Obsibrain in our guide.
Crafting Your Daily Mood Tracker Template
Alright, with the essential plugins installed, it's time to build the heart of your new system: the daily mood tracker template. This isn't just a simple note. Think of it as a smart script that the Templater plugin will use to generate a fresh, perfectly structured entry for you every single day. The goal here is to make logging your mood so quick and easy that it becomes second nature.
The secret to a powerful tracker is clean, readable data. We'll use YAML frontmatter for this—a small block of text right at the top of your note that acts like a set of data labels. Obsidian's Dataview plugin can read these labels in a flash, making it incredibly simple to query your mood, energy, and other metrics down the road. This structured approach is what elevates simple journaling into systematic, insightful tracking.
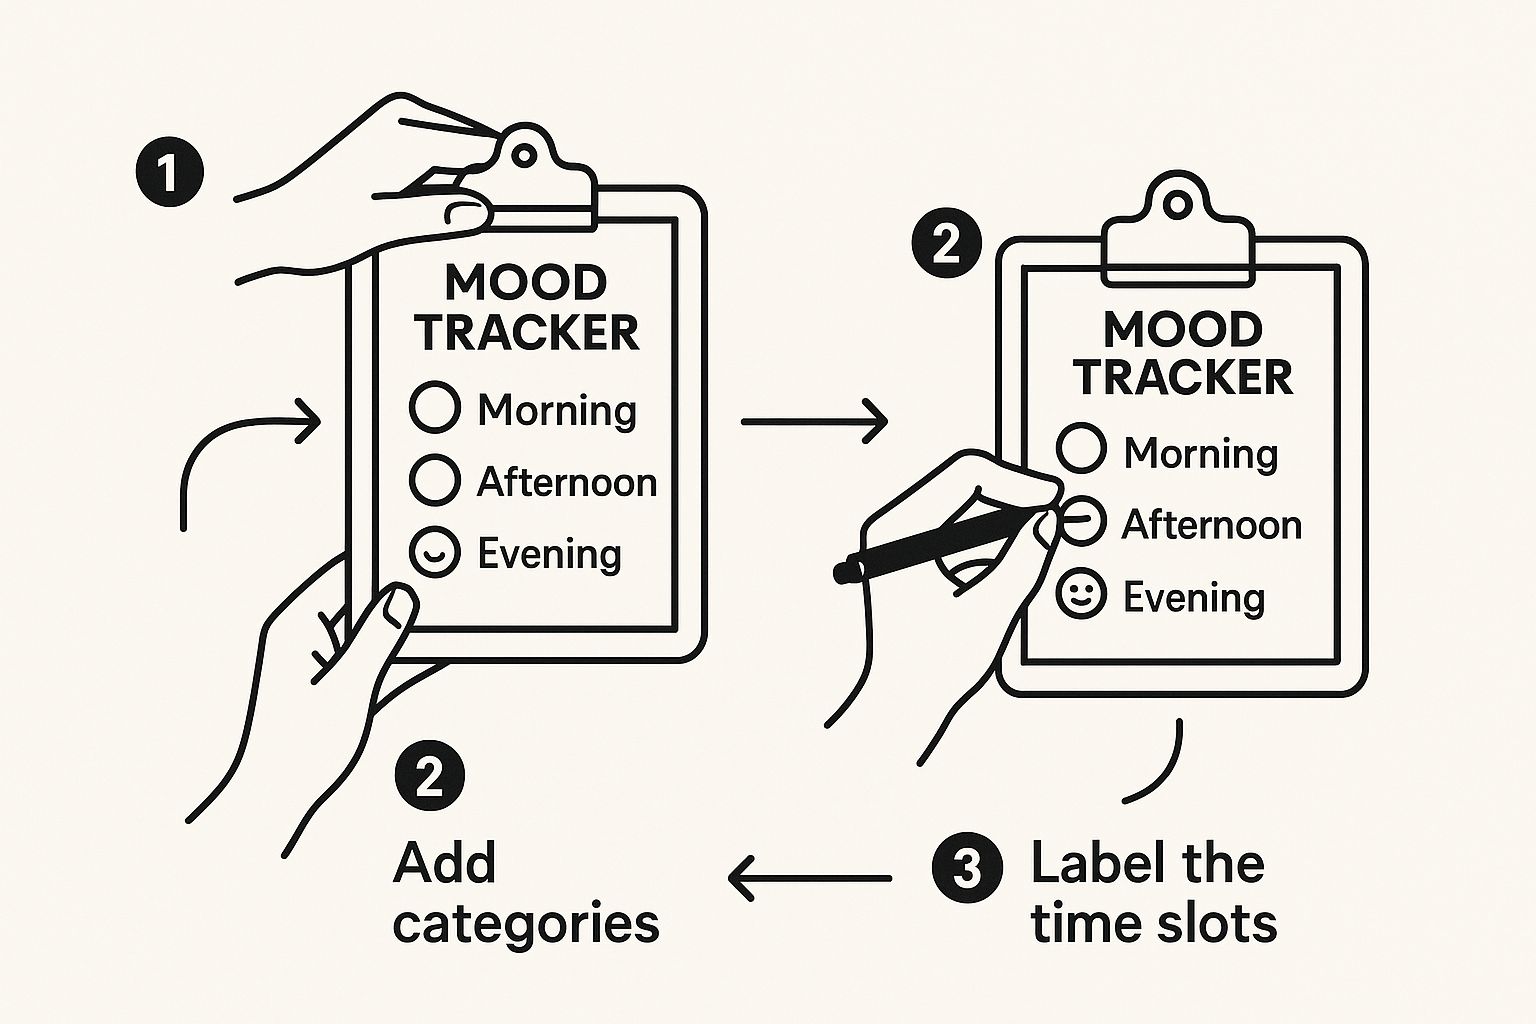
You can start with a basic template and then layer on different categories to create a truly personal tracking experience.

The key takeaway is to build a foundation you can easily expand. Start small, see what works, and gradually add elements that reflect your own wellness journey.
Building The Template Core
Let's begin with a solid, no-fuss foundation. First, create a new note inside the templates folder you designated earlier (mine is Templates/Daily Note). Once you have a blank note, paste the following code block into it.
creation_date: <% tp.date.now("YYYY-MM-DD") %> mood: energy: tags: dailynote
Daily Log for <% tp.date.now("dddd, MMMM Do YY") %>
How am I feeling today?
Mood (1-5):
Energy (1-5):
What did I do today?
Journal:
This simple structure is surprisingly effective. The YAML frontmatter logs the creation date and tags the note for easy filtering later on. Meanwhile, the Templater syntax <% ... %> automatically pulls in the current date, saving you from typing it out every time.
If you're curious about the mechanics behind this, the Obsibrain documentation has a great explanation of https://docs.obsibrain.com/faq/what-is-a-template.
Making The Tracker Your Own
The real magic happens when you start customizing. Your life isn't a one-size-fits-all template, and your tracker shouldn't be either. You can easily add new fields to both the YAML section at the top and the main body of the note.
Here are a few ideas to get you started:
Sleep Quality: A simple 1-5 scale can reveal powerful connections between rest and mood.
Social Interaction: Did you spend quality time with others? A simple
yes/nocheckbox can work wonders.Diet: Make a quick note if you ate particularly healthy or felt sluggish after a certain meal.
Before we dive into creating the tracker, it's helpful to plan out what you want to measure. A clear structure ensures your data is consistent and easy to analyze later.
Core Template Fields and Their Purpose
mood
Number (1-5)
This is your primary metric. It provides a quick, quantifiable snapshot of your emotional state each day.
energy
Number (1-5)
Helps identify correlations between energy levels, activities, and overall mood. Are certain activities draining you?
sleep_hours
Number
Sleep is a massive factor in mental well-being. Tracking hours can reveal patterns you might otherwise miss.
activities
Checkboxes/Tags
Connects your mood to specific events. Did socializing boost your mood? Did a tough workout drain your energy?
journal
Text
This is your space for context. It adds the "why" behind the numbers, capturing nuances that data alone can't.
Having these core fields gives you a robust dataset to work with when you start visualizing your trends.
Customizable templates are a big deal on other platforms, too. For example, Notion users often build intricate wellness systems with visual calendars and journaling prompts. If you want to get some inspiration, you can find a lot of ideas from their community. And to give your Obsidian template a unique visual flair, you could even learn how to make custom icons to represent different activities or feelings.
Visualizing Your Emotional Patterns
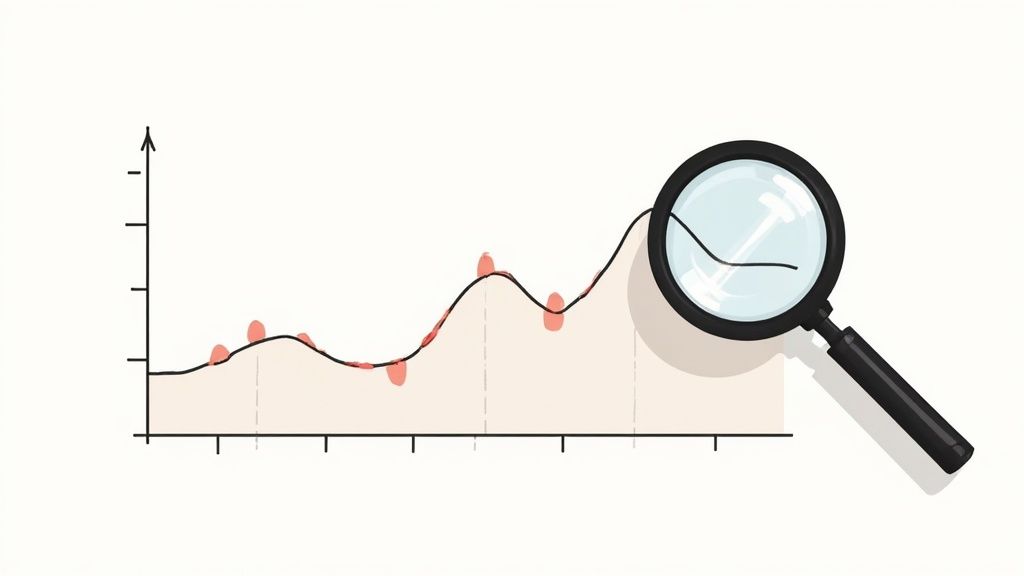
Jotting down your mood in daily notes is one thing, but seeing the bigger picture is where the real magic happens. This is how you go from just collecting data to actually understanding your own emotional landscape. When you start visualizing the info from your mood tracker template, you can spot connections you’d never notice by looking at individual notes.

This idea isn't new. Think about those fancy digital spreadsheets, like the popular 2025 Digital Mood Tracker Spreadsheet you might see on Etsy. They use charts and graphs to show trends in mood, sleep, and daily activities. We can build something even more powerful and personal right inside Obsidian.
Building a Wellness Dashboard with Dataview
Your first move is to create a central dashboard. This is just a single note where you'll use Dataview queries to pull everything together from your daily entries. It’s your emotional command center.
Here’s a simple query to get you started. Just copy and paste this into your dashboard note. It’ll create a neat table showing your mood and energy ratings from the last 14 days, perfect for spotting recent patterns.
TABLE mood, energy FROM #dailynote WHERE file.ctime >= date(today) - dur(14 days) SORT file.ctime DESC
This table is great for a quick, scannable overview. But tables can feel a bit flat. They show you what you felt, but they don't always explain why. For that, we need to see the connections.
Deeper Connections with Obsibrain
This is exactly where Obsibrain shines. While Dataview is fantastic for summarizing metrics in a list, Obsibrain is all about revealing the relationships between your notes. Let's say you've noticed a spike in anxiety. With Obsibrain's graph view, you can instantly see every single note linked to the word "Anxious."
The graph doesn’t just give you a list; it paints a picture. You might suddenly see that your 'Anxious' mood is consistently linked to a specific work project, a recurring weekly meeting, or even a particular person you mention in your journal.
This visual, intuitive approach is incredibly powerful for uncovering hidden triggers and positive influences that a simple table would completely miss. It helps you build a much richer story around your emotional data. To learn more about using Obsibrain for this kind of analysis, check out our guide on setting up periodic reviews.
Going Deeper: Turning Data Into Real Insights
Alright, you've got the system running. Data is flowing in. Now for the fun part: turning all that raw data into something you can actually use. This is where the real magic happens, moving beyond just logging numbers to genuinely understanding yourself. The whole point of an integrated mood tracker template is to connect your emotional state to the actual context of your life.
A simple habit that pays huge dividends is getting more specific with your tags in daily journal entries. Don't just log your mood. Add tags that give it context, like #work-stress, #good-day, or #creative-flow. Trust me, this small change makes your Dataview queries infinitely more powerful down the road.
Creating High-Level Reviews
You can start creating dedicated notes for monthly or quarterly reviews. In these notes, you can use Dataview to pull back and look at the bigger picture—things like your average mood score for the period or how many high-energy days you had.
This isn't just about crunching numbers. It’s a prompt for reflection. Seeing your mood consistently dip in March might make you ask, "What was going on then?" Suddenly, you're connecting the data points to real-life events.
Another powerful technique is to build out Maps of Content (MOCs) for specific emotions. This is where a tool like Obsibrain really shines.
Think of an MOC as a central hub for a topic. You could create an "Anxiety MOC," for instance. With Obsibrain, you can set up this note to automatically find and link to every single journal entry, project note, or meeting summary where you've tagged or even just mentioned anxiety.
What you end up with is an incredibly rich, interconnected map for self-discovery. A great use case here is to open the Obsibrain graph view centered on your "Anxiety MOC." You would instantly get a visual web showing how anxiety connects to #deadlines, [[Project Phoenix]], and [[Weekly Sync Meeting]]. This reveals patterns you would almost certainly miss otherwise, taking you from just tracking feelings to actively understanding what triggers them.
Of course, even with a great setup, some questions are bound to pop up. Let's tackle a few common ones I hear, because smoothing out these little wrinkles is key to sticking with your mood tracker for the long haul.
Can I Use This on My Phone?
Absolutely. As long as your Obsidian vault is synced using a service like iCloud or the official Obsidian Sync, your template and daily notes are fully accessible on your phone.
This is a huge deal for consistency. Being able to log your mood the moment you feel it, wherever you are, makes the whole process feel effortless.
What If I Miss a Day of Tracking?
Don't sweat it—this happens to everyone. The goal here is consistency, not perfection.
The Calendar plugin is your best friend in this situation. It makes it super simple to click back to a past date and fill in the details if you remember them. If not? Just start fresh the next day. A few missed entries won't break your ability to spot those important long-term trends.
One of the best parts about this system is that your mood data is exceptionally private. Unlike most cloud-based apps, all your notes are stored locally as plain text files on your device. You have 100% control.
How Can I See Connections Between Moods?
This is where the magic really happens. While Dataview is fantastic for giving you clean summaries and tables, Obsibrain is what helps you see the web of connections.
As a specific use case, imagine you have a [[Habit - Morning Walk]] note and a [[Habit - Late Night Scrolling]] note. When you mention these in your daily entries, Obsibrain can build a visual graph showing that your "high mood" days are frequently connected to the morning walk, while "low energy" days often cluster around late-night scrolling. It reveals these cause-and-effect relationships in a way that simple lists and tables just can't.
Ready to transform your scattered notes into an interconnected map of your emotional landscape? Obsibrain provides the structure and visualization tools to turn your data into deep, actionable insights. Start building a more self-aware productivity system today.
Last updated